Enterprise Risk Management
Your Top Risk May Be Three Medium Risks
Risk registers score exposures one at a time. The expensive ones arrive together, through a connection nobody wrote down.
By Eric Kennedy · Originally published Thu Aug 20 2026 · Updated Thu Aug 27 2026 · 13 min read

TL;DR
A risk interdependency is a relationship between two or more risks in which one can trigger another, amplify another's impact, or block the planned response to another. Conventional risk registers score each risk in isolation and leave the combined exposure undefined, which is why a company can hold three items rated medium and still face a major loss. The fix is not a correlation model. It is a short, disciplined test of three to five plausible combinations, examined through four questions: what triggers it, how it spreads, what limits the response, and where it lands financially. In a study of 827 supply chain disruptions, stock underperformance was already evident in the year before the disruption was publicly announced, which suggests the operational problem and its effects often precede the moment anyone names the event.
A Tuesday That Was Never on the Register
Start with a manufacturer at $180 million in revenue. The register is current, the scoring workshop happened in the spring, and the audit committee saw the output in June. Three items sit at medium.
A molded component comes from a single supplier. Medium. The second shift has been running short on qualified operators since two retirements in the fall. Medium. The largest customer is 22 percent of revenue. Medium.
None of the three would move a board. Each has an owner, a mitigation note, and a review date. On the heat map they are three separate dots in the same amber zone, and the June discussion covered all three in about eleven minutes.
Then the supplier slips three weeks. Production reschedules around it, exactly as the mitigation note said it would. The recovery plan calls for catching up on the second shift, except the second shift is the thing that has been short since the fall, so the catch-up runs at roughly 60 percent of the assumed rate. The delivery window for the largest customer closes.
What follows is a contractual penalty, an expedite bill, a difficult call, and a supply agreement coming up for renewal against a fresh service record. Three mediums produced one outcome that no single line on the register described.
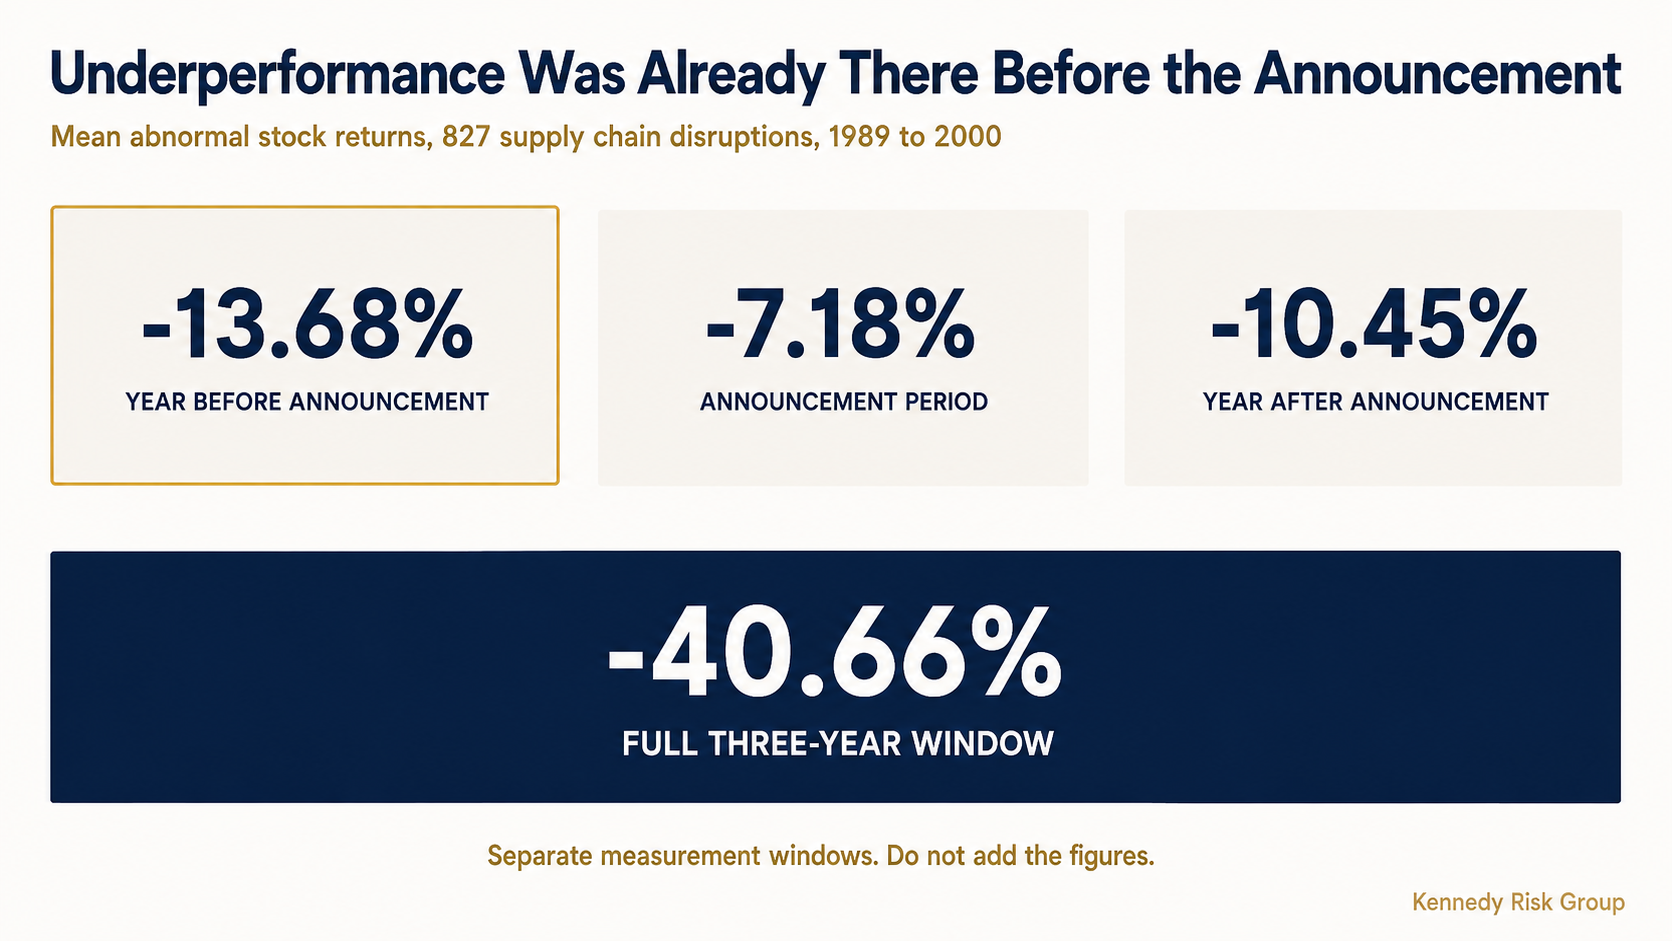
The research suggests something uncomfortable about the timing. Hendricks and Singhal examined 827 publicly announced supply chain disruptions between 1989 and 2000 and tracked stock performance from one year before the announcement through two years after. Across that window the mean abnormal return was roughly negative 40 percent. The narrower finding is the one that matters here: in the year before the disruption was announced, the mean abnormal return was already negative 13.68 percent, statistically significant at the 0.001 level. The authors read this as partial anticipation, meaning the market was picking up signals before the company said anything.
Read that alongside a risk register and it lands differently. By the time a company publicly announces a disruption, the operational problem has often existed for some time and its effects have already started to show. The announcement is not the event. It is the point at which the situation becomes visible from outside.
Three limits, stated plainly. The study does not establish that markets perceive dependency chains, and reverse causality is live: firms already deteriorating may simply be more prone to disruption. The sample is publicly traded firms across a period ending in 2000. And the window opens one year before the announcement, so what it shows is that underperformance was present in that year, not that it started there.
What does transfer is scale. The median company in the sample had $116.8 million in annual sales, against a mean of $2.05 billion skewed by a few giants. Grouped by market value of equity, the two smallest deciles averaged negative 47.05 percent against negative 19.6 percent for the two largest, though the pattern is uneven and the authors describe it only as some evidence that smaller firms were hit harder. Whatever this describes, it does not describe only large companies.
The Hidden Assumption Is Not Independence. It Is Isolation.
It would be tidy to say that scoring risks separately assumes they are independent. That claim is wrong, and it is worth being precise about why.
A register that rates each risk on its own is not performing a calculation that treats the risks as statistically independent. It is not performing a calculation at all. It assesses each item, records a score, and leaves the combined exposure undefined. No assumption about dependence is made, stated, or tested.
Your risk register does not prove your risks are independent. It simply never asks what happens when they are not.
That is a smaller claim and a more damaging one. An explicit independence assumption could at least be challenged in a meeting. Isolation is invisible, because nothing on the page announces it. The register looks complete, every field is populated, and the gap is structural rather than an error anyone made.
This also explains why executives dismiss combination scenarios when they first hear them. Presented as three mediums going wrong at once, the scenario sounds like a coincidence, and coincidences feel unlikely. But it is not a coincidence. It is one trigger colliding with two vulnerabilities that were already present. The operator shortage and the customer concentration were not events that had to happen. They were standing conditions, sitting on the register, waiting.
Disciplines with harder consequences formalized this long ago. In nuclear probabilistic risk assessment, the term is common-cause failure, meaning multiple redundant components failing from a single shared cause rather than independently. In NUREG-2225, published in September 2018, the NRC states that increased potential for common-cause failure is often a substantial contributor to the risk significance of an equipment performance deficiency. That is reliability engineering applied to redundant hardware, not a business statistic, and it should not be borrowed as one. What transfers is the concept: the thing that gets you is often not several separate failures.
Where Combinations Actually Come From
Interdependency is not evenly distributed across a register. It concentrates around shared dependencies, and in a mid-market company there are usually only a handful worth naming.
A shared dependency is any resource, relationship, or constraint that more than one risk runs through. Five categories cover most of what surfaces:
Vendors and suppliers. One provider appearing in the mitigation plan for several unrelated risks. Note the plans specifically, because the concentration usually hides in the response rather than the exposure.
Systems and platforms. The ERP or the single integration layer. Concentration here is often invisible on a register because no line item is called "the system."
Facilities and geography. One plant, one distribution center, or one region carrying multiple risk lines.
People and skills. A capability held by a small number of individuals, which is what turns a staffing risk into a response constraint.
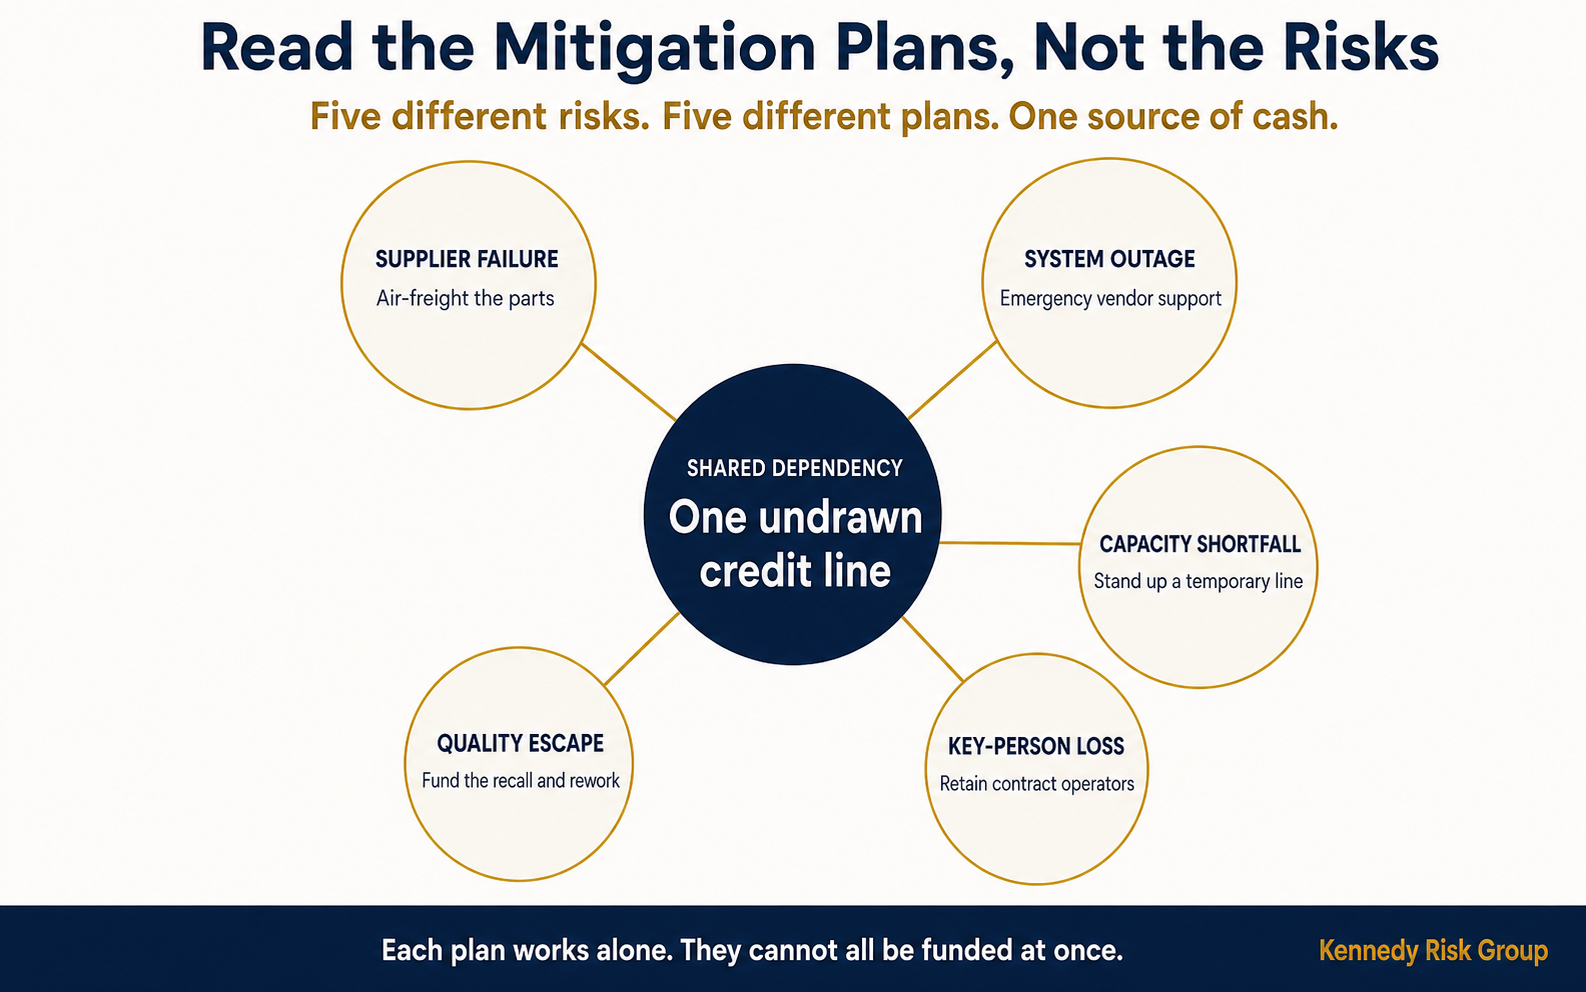
Liquidity and capital. Often missed, and the one CFOs are best positioned to catch. Many mitigation plans quietly assume that cash, capacity, people, or time will be available when needed, without anyone having reserved them. If four responses all draw on the same undrawn capacity, those four risks are connected whether or not anyone has said so.
The AICPA and North Carolina State University 2025 State of Risk Oversight, drawing on 273 US organizations surveyed in Spring 2025, found that only 30 percent of respondents integrate risk exposure into capital allocation decisions, while 61 percent report that the volume and complexity of risks changed mostly or extensively over the prior five years. Complexity is being felt. The financial plumbing that would connect it to a decision is mostly not connected.
The KRG Risk Chain
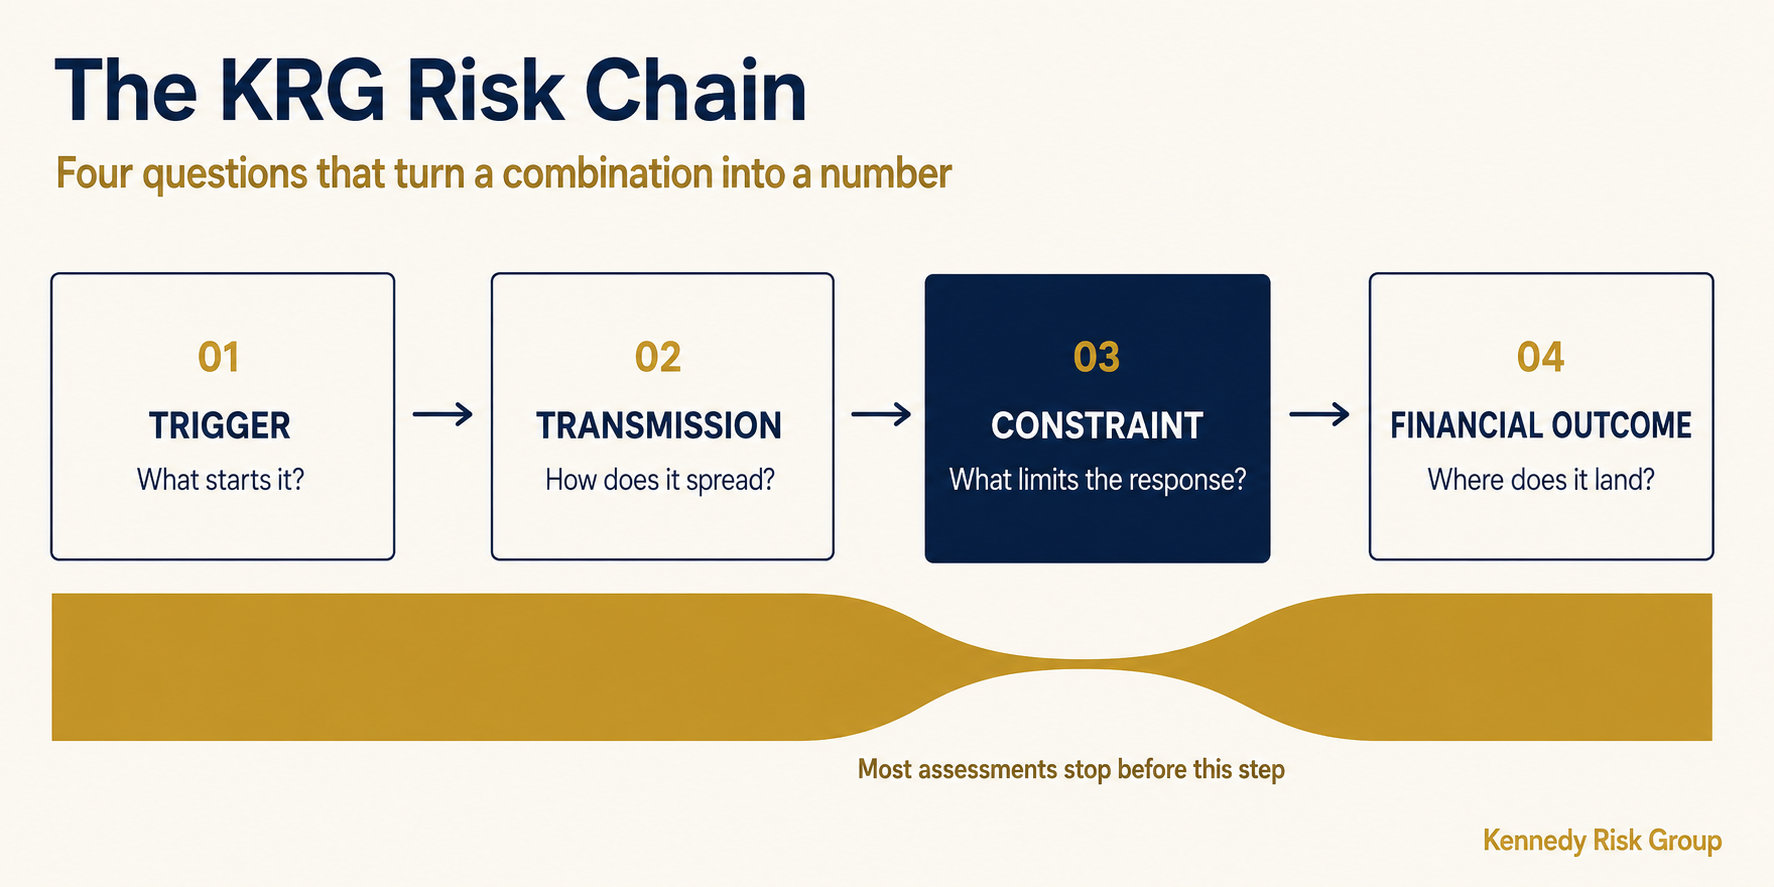
Once you have two or more risks that plausibly connect, there is a practical way to examine the combination: four questions, asked in order. I call this the KRG Risk Chain.
Trigger. What starts it? Name a specific initiating event with a date and a magnitude, not a category. "Supplier delay" is a category. "The molded component slips three weeks in Q3" is a trigger.
Transmission. How does it move? Trace the path across functions, systems, or counterparties. This is where a single event stops being one department's problem.
Constraint. What limits the response? This is the question conventional risk assessment skips, and it is where the real damage lives. Every mitigation plan assumes a resource is available: cash, capacity, people, time, an alternate source. The constraint is the moment that assumption fails. Survivable problems become an expensive problem at the constraint, not at the trigger.
Financial outcome. Where does it land? Revenue, margin, liquidity, covenant headroom, or enterprise value, expressed in dollars and a time period. A chain that cannot be connected to a business outcome and bounded in dollars is not yet something a board can act on.
The framework is not a claim to have discovered that risks interact. It is a claim about sequence: most risk analysis stops after transmission, and the constraint question is where a combination stops being interesting and starts being expensive.
A risk register shows the ingredients. A risk chain shows what happens when they interact.
Hendricks and Singhal reached a similar structure from the operations side. Their conclusion describes how outsourcing heightened interdependencies between nodes so a problem in one link ripples through the rest, and how cutting inventory and slack tightly coupled those links and left little room for error. Transmission, then constraint, in the language of a supply chain paper.
Testing Combinations Without Building a Model
The obvious failure mode here is enthusiasm. Dependency mapping expands without limit if you let it, and a team that starts drawing a network diagram of the enterprise will produce something impressive, unmaintainable, and never referenced again.
The discipline is narrow. Test three to five combinations. Each one must either share a named dependency or form a causal path that runs entirely through conditions already present and already named on the register. Imagined conditions do not qualify, because that is the door through which the exercise expands past usefulness. Then stop.
A practical sequence:
- Pull the register and list the shared dependencies rather than the risks. As a rule of thumb from practice, not a published finding, most mid-market registers of 30 to 60 lines collapse into roughly eight to twelve dependencies.
- Find dependencies carrying two or more risks, and separately note any risk whose mitigation plan depends on another risk not occurring. Both are candidates.
- Rank the candidates by how many mitigation plans, not risk descriptions, run through them.
- Take the top three to five and run each through the four questions.
- Compare the chained financial outcome to the sum of the individual scores.
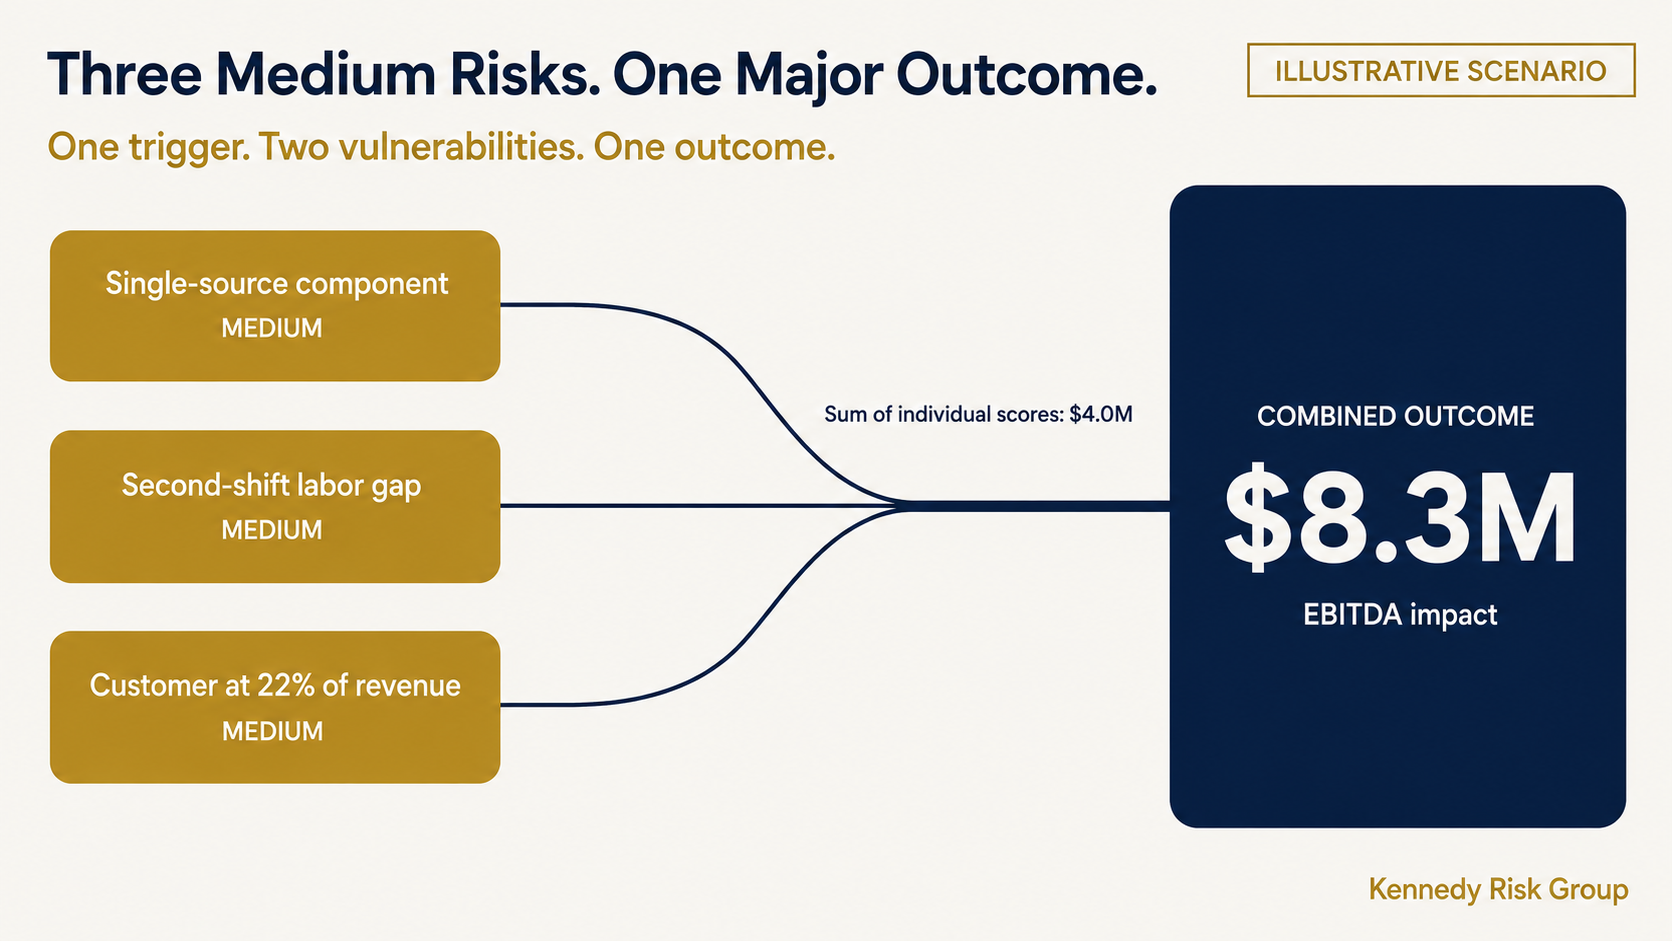
Applied to the manufacturer, the comparison looks like this. The figures are illustrative and constructed to show the arithmetic. They are not drawn from any engagement.
| Risk | Scored alone (EBITDA) | Role in the chain |
|---|---|---|
| Single-source molded component | $1.2M | Trigger |
| Second-shift operator shortage | $0.8M | Removes the recovery option |
| Top customer at 22% of revenue | $2.0M | Converts a delay into a lost account |
| Sum of individual scores | $4.0M | |
| Penalty and expedite cost | $3.5M | |
| Contribution lost on a 40% volume reduction at the top account | $4.8M | |
| Chained outcome | $8.3M |
Two things are worth noticing. The chained figure is roughly twice the sum of the parts, which is meaningful without being dramatic, and anyone presenting a ten-times number should expect to be asked why. And an $8.3 million EBITDA swing at this revenue scale is the kind of movement that puts a debt covenant into the conversation, which none of the three risks individually would have done. That changes who is in the room.
Sometimes this exercise returns nothing. You run five combinations and find that the risks genuinely do not touch, the dependencies are not shared, and the register was right to leave them separate. That is a legitimate and useful result. A method that always finds a hidden catastrophe is not a method.
What the Board Should See
Combination analysis fails in the reporting layer more often than in the analysis layer. Boards receive heat maps, and a heat map is structurally incapable of showing that two dots are connected. It has axes for likelihood and impact and no axis for dependency. That is a display limitation rather than a flaw in the people using it, and it is separate from the argument about scoring exposure in dollars instead of colors, which is worth reading on its own at why your risk heat map is failing the board.
What works in a board pack is one page per tested chain, containing five things:
- The connection itself, named plainly, whether that is a shared dependency or a causal path.
- The risks that run through it, with their individual ratings shown so the contrast is visible.
- The chain in four steps.
- The financial outcome with a time period.
- The single named owner of the connection, not of the individual risks.
That last item changes behavior. Individual risks usually have owners. The connections between them usually do not, because they sit between functions. Procurement owns the supplier, operations owns the labor plan, sales owns the customer, and nobody owns the fact that all three run through the same quarter. Naming that owner is most of the value of the exercise, and it costs nothing.
A reasonable objection: this adds a step to a process many mid-market teams already struggle to sustain. True. Combination testing is an overlay on a working risk cadence, not a substitute for one. If the quarterly rhythm is not yet reliable, fix the rhythm first.
Shared dependencies also appear in audit criteria. The IIA's Organizational Resilience Topical Requirement asks auditors to assess critical third-party identification and alternative suppliers, discussed in business continuity is not organizational resilience. Deciding which of these combinations is worth board time is covered in board risk oversight and what earns the agenda slot.
Where to Start
Pull your current risk register and do not read the risks. Read the mitigation plans, and write down every vendor, system, facility, person, and funding source that appears in more than one. That list, which usually takes about an hour to produce, is your dependency map. If any single entry appears in three or more mitigation plans, you have found the combination worth testing first.
If that hour surfaces something you were not expecting, the next question is whether it is an isolated gap or a symptom of how the program is built. The ERM Program Diagnostic is a one-to-two-week, fixed-fee review designed to answer exactly that for mid-market organizations, and the fee is credited toward a larger engagement if you move forward. If you would rather start with a self-assessment, the Board-Ready Risk Reporting Scorecard gives you a tier-level read in about six minutes with no email required to see your score.
Explore the ERM Diagnostic Take the ERM Scorecard
Frequently Asked Questions
Can three medium risks add up to a major risk?
Yes. Three risks rated medium can produce a major loss when one triggers an event the other two are already positioned to worsen. The combination is most dangerous when one risk removes the response option for another, such as an operator shortage that eliminates the overtime plan meant to absorb a supplier delay. A register that scores each risk separately will not show this, because it records severity and never records the relationship between items.
What is a risk interdependency in enterprise risk management?
A risk interdependency is a relationship between two or more risks in which one can trigger another, amplify another's impact, or block the planned response to another. Many interdependencies arise from a shared dependency: a common supplier, system, facility, key person, customer, or funding source that several risks run through. Interdependency is different from correlation, which describes risks that tend to move together statistically without any identified mechanism connecting them.
What is the KRG Risk Chain?
The KRG Risk Chain is a four-question method for examining how several risks combine into one financial outcome. The questions are trigger, the specific initiating event; transmission, how the effect spreads across functions, systems, or counterparties; constraint, what limits the organization's ability to respond; and financial outcome, where the effect reaches revenue, margin, liquidity, or enterprise value in dollars over a stated period. The constraint question is the one most risk assessments skip, and it is usually where a survivable problem becomes an expensive one.
How do you identify shared dependencies in a risk register?
Read the mitigation plans rather than the risk descriptions. Concentration usually hides in the planned response, because several unrelated risks often name the same supplier, system, facility, individual, or source of cash as part of the fix. List every such resource appearing in more than one plan, and flag any plan that depends on another risk not occurring. Any dependency appearing in three or more mitigation plans is the first combination worth testing.
Should a mid-market company build a risk correlation model?
No. Formal correlation modeling is built for insurers and banks with large loss datasets and capital requirements that demand it, and a mid-market company rarely has the loss history to calibrate one. Test three to five plausible combinations, carry each through to a dollar figure, and stop. That gets most of the value at a fraction of the effort. If the work starts to resemble a network diagram of the enterprise, it has expanded past the point of usefulness.