Enterprise Risk Management
Your Forecast Range Is a Claim. Test It.
Before accepting an 80% confidence range, ask to see the old ones. A practical review of forecast coverage, width and the cash decisions they support.
By Kennedy Risk Group · Tue Oct 20 2026 · 8 min read

Before accepting an "80% confidence" forecast range, ask to see the old ones.
Not the latest reforecast. The ranges management recorded before it knew the outcome, alongside what actually happened. If nobody has kept that record, the percentage is an assertion you have not tested.
Forecast calibration asks whether outcomes land inside a stated range as often as its probability label implies. A useful review checks that coverage, the direction and size of misses, and how wide the range was. Getting the central estimate close is a different achievement.
This matters when the forecast supports a commitment you cannot easily reverse: inventory bought, capacity reserved, a distribution approved. The question is not whether finance can predict the future perfectly. It is whether management is committing cash on the strength of uncertainty estimates it has never checked.
Experience did not fix the ranges
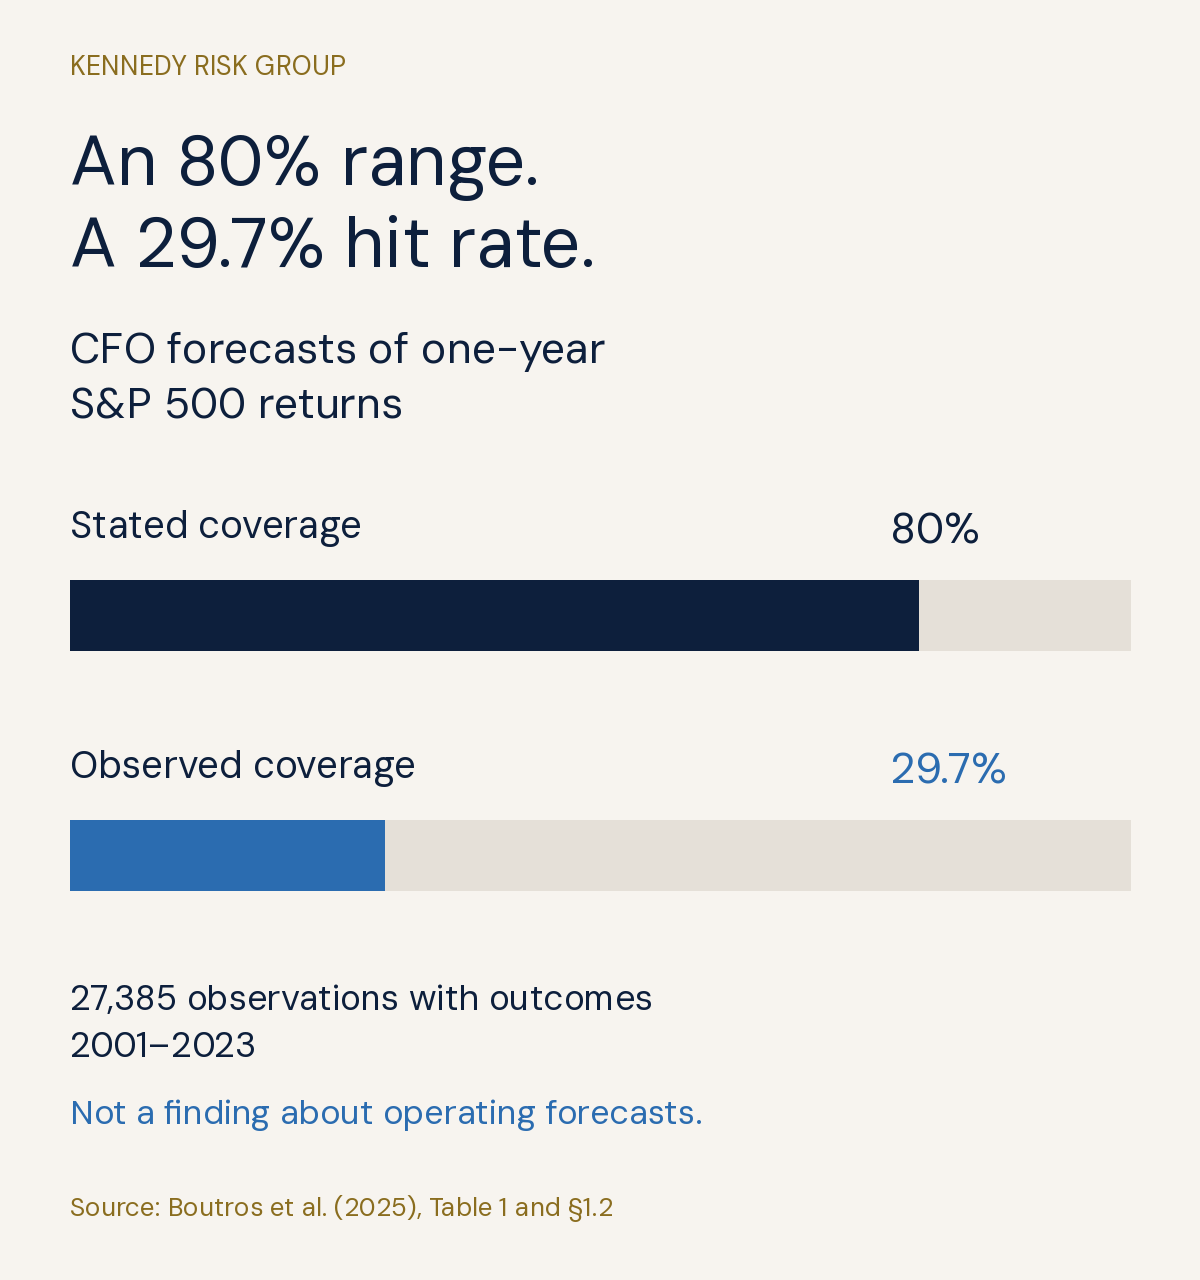
A 2025 study by Boutros and colleagues in The Review of Financial Studies, The Persistence of Miscalibration, examined 28,413 CFO forecasts of one-year S&P 500 returns across 2001–2023. The stated 80% intervals contained the realized return only 29.7% of the time, among 27,385 observations with an outcome (Table 1 and section 1.2). Repeated forecasting did not materially improve calibration.
These were voluntary survey responses about the stock market, not an audit of the participants' operating forecasts or a representative sample of mid-market firms. The study observed learning opportunities; it did not test a structured feedback intervention. It cannot tell you how inaccurate your cash ranges are, or that a review will fix them.
It does give a reason to test the ranges rather than rely on the forecaster's experience.
Start with the decision, then freeze the forecast
Pick one recurring forecast that affects a real commitment. Collections over the next month may be more useful than a company-wide exercise involving dozens of metrics. Choose the horizon at which someone actually decides, not the horizon that makes the forecast look best.
An eight-week cash estimate and a one-week estimate answer different questions. Mixing them rewards the team for learning more as the payment date approaches. If the purchase order was authorized eight weeks out, that is the forecast worth evaluating for that decision.
For the chosen series, preserve the release date, outcome date, units, central estimate, lower and upper bounds, stated probability, and the information available when it was issued. Record who approved any judgmental adjustment. Keep revisions as new versions instead of overwriting the original.
If historical ranges do not exist, say so. You can reconstruct a model using only information available at each past date, but call that a backtest. Do not present reconstructed bounds as the uncertainty management actually expressed. Start keeping prospective records now.
This is narrower than connecting the budget to risk and capital allocation. That work asks which assumptions could break the plan. This review asks whether a particular forecast's uncertainty claim deserves the confidence placed in it.
Make "80%" mean something
A target is what management wants. A forecast is what it expects. A downside scenario is a conditional story. None automatically supplies a probability range.
For a central 80% prediction interval, the intended split is 10% below the lower bound, 80% inside, and 10% above the upper bound across comparable forecasts. The interval need not be symmetric around the central estimate. An arbitrary plus-or-minus percentage is not evidence for that probability claim. Hyndman and Athanasopoulos explain prediction intervals and their evaluation.
Ask the forecast owner what supports each boundary. Is it historical forecast error at this horizon, a model, a documented judgment, or simply the downside case used in the presentation? You do not need to pretend those methods are equivalent. A judgmental range can be useful if its basis and limits are visible.
Management must also retain scenarios outside the central range. A cash outcome below its lower bound is not impossible. A stated interval does not define how much loss the company is willing or able to absorb.
Count misses without turning the review into a league table
Once outcomes arrive, mark each one below, inside or above its original interval. Calculate coverage as the number inside divided by the number evaluated. Keep the width, the distance outside the nearest boundary when there is a miss, and the central-estimate error alongside it.
The first useful finding may be directional. If misses cluster below a collections range, investigate which receipts arrive late and whether forecast owners are treating promised payment dates as committed cash. If both boundaries are repeatedly breached, the uncertainty estimate may be too tight. Neither pattern identifies the cause by itself.
Do not declare a forecaster calibrated because four of five observations land inside an 80% range. Small samples move sharply with one result. Several business units can also miss together because they share a customer or economic shock. Those are not independent demonstrations of the same weakness.
Group observations by metric and horizon, and look at changes in the business. A new product launch should not inherit the apparent reliability of a stable installed base without examination. A major acquisition may make older errors less informative. Keep those distinctions in the review instead of manufacturing one clean percentage for the board.
There is a management choice here too: make it safe to report wider uncertainty when the evidence warrants it. If a wider range is treated as poor performance, the review creates a reason to hide uncertainty. Hold people accountable for evidence and follow-through, while keeping delivery targets separate.
Do not let a wider range win by default
An interval that includes almost everything will rarely miss. It may also tell the decision-maker almost nothing.
One established way to evaluate both width and misses is the Winkler interval score. For an 80% interval, the score is its width plus ten times the distance of any outcome outside the nearest boundary. Inside the range, that extra penalty is zero. Lower scores are better across comparable forecasts. Compare the same metric, units, horizon and interval probability; the score is not a financial loss estimate.
Consider the following illustrative scenario, constructed to show the calculation. Three methods issue 80% ranges for the same monthly collections amount. Actual collections are $8 million. Their central estimates are omitted because this comparison evaluates intervals.
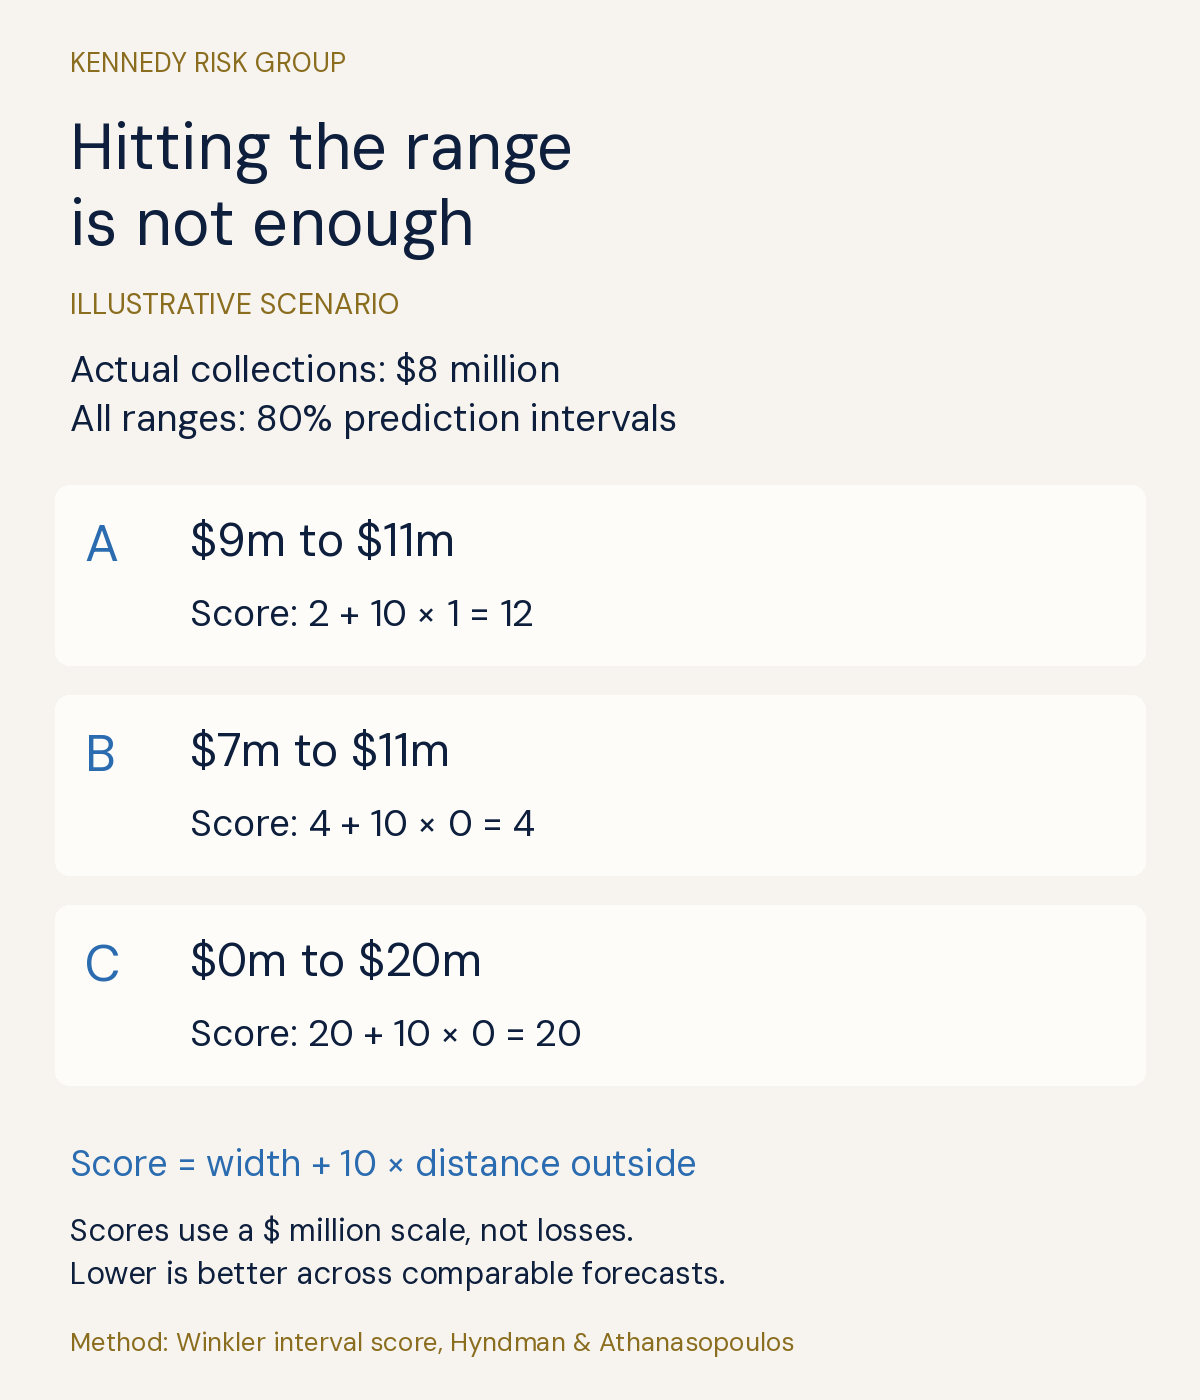
Method B is best on this single observation, not proven best in general. Method C contains the outcome but offers much less precision. Method A's narrow range misses, and its score reflects that miss. Keep evaluating new forecasts; do not choose a method by finding one month that flatters it.
The calculation behind the comparison
All amounts and scores below are expressed on a $ million scale. The score combines width and a statistical penalty; it is not dollars lost or a reserve recommendation.
| Method and 80% range | Width | Distance outside | Interval score |
|---|---|---|---|
| A: $9m to $11m | 11 − 9 = 2 | 9 − 8 = 1 | 2 + 10 × 1 = 12 |
| B: $7m to $11m | 11 − 7 = 4 | 0, inside | 4 + 10 × 0 = 4 |
| C: $0m to $20m | 20 − 0 = 20 | 0, inside | 20 + 10 × 0 = 20 |
You can begin with coverage and width if a formal score would distract from fixing the records. The point of the calculation is to prevent "we included the actual" from becoming the only test of quality.
Bring the result back to the cash commitment
A forecast review should end with an operating decision, not a better-looking chart.
In the illustrative collections example, suppose an irreversible purchase depends on receiving at least $9 million. Method B's range extends below that amount. That does not give you the exact probability of a shortfall, but it does rule out treating $9 million as a dependable floor merely because it sits below a central estimate.
Before approving the purchase, ask what cash is already available, which receipts are genuinely committed, whether payment can be staged, and what happens if collections arrive late. Obtain the missing information or change the commitment. Do not force the forecast range to support the decision management prefers.
Reverse stress testing serves a different purpose: it starts with an unacceptable outcome and works backward. Use it when you need to understand how the business could cross a cash limit, including outcomes beyond a central forecast range.
Not every forecast warrants this effort. A reversible, low-cost decision may need no interval review. A sparse or changing data set may not support a credible numeric probability at all. In that case, a plainly described scenario and a reversible commitment can be more honest than an untested "80%."
For the next forecast review, request the original ranges and subsequent actuals for one decision-critical series. If the evidence is missing, assign someone to preserve it. If the misses matter, decide what changes before the next commitment. The executive risk reporting deck provides an existing format for taking that decision to the committee without building another reporting pack.
If the uncertainty is visible but nobody owns the response, the problem is wider than forecasting. The KRG scorecard is a short starting point for assessing whether your risk reporting connects evidence, ownership and executive action. It does not validate a forecast model.
Frequently Asked Questions
What is the difference between forecast accuracy and calibration?
Point accuracy concerns how close a central estimate is to the outcome. Range calibration concerns whether outcomes fall inside stated intervals at the intended frequency across comparable forecasts. Review range width as well as coverage; a very wide range can contain outcomes without helping a decision.
Can a downside scenario be called an 80% forecast range?
Not without a basis for the probability claim. A scenario describes what happens under specified conditions. Record whether your range comes from a model, historical errors or documented judgment, and test its coverage as outcomes arrive.
How many forecasts are enough to test calibration?
There is no universal minimum that makes a review conclusive. It depends on the probability level, dependence between outcomes, forecast horizon and stability of the business. A few observations can expose missing records or suggest a pattern, but they cannot establish reliable calibration.