Risk Strategy
Customer Concentration Risk: Your Revenue Share Misses the Exposure
A customer can represent 20 percent of revenue and much more of the economics that keep the plan working. Review the dependency before choosing the response.
By Eric Kennedy · Tue Sep 29 2026 · 9 min read

Customer concentration risk is the exposure created when too much of a company's business depends on one customer or a group that can act together. Revenue share is the starting point. A useful review also shows the contribution that customer supports, the cash still owed, and how quickly the company could respond if the relationship changed.
For a mid-market CFO, the question is specific: which customer decision could force us to change our own plan?
Start with the customer list you already have. Reconcile it to finance, group related accounts, and examine the economics before setting a percentage limit. A large account may be worth keeping and growing. The purpose of the review is to make the dependency an informed choice.
Count decisions, not just customer records
Five billing accounts do not necessarily represent five independent relationships. They might belong to the same parent or buy under a single procurement agreement. A list of legal entities can look diversified while one buying decision controls the exposure.
Keep two views. The accounting view follows the applicable reporting requirements. The management view also identifies shared buying decisions, renewal dates, channels and end markets. Do not merge unrelated customers into one accounting customer simply because they face similar conditions. Flag the common exposure separately.
IFRS 8, paragraph 34 illustrates why the distinction matters. For entities within its scope, it requires major-customer disclosures when a single external customer provides at least 10 percent of revenue and treats entities known to be under common control as one customer. That is a disclosure rule under a particular accounting standard. It is not a universal safe limit for customer concentration, and it does not mean every private US company must apply IFRS 8.
For the management review, ask sales to mark who can actually change the order volume, price or payment terms. Ask finance to reconcile the grouped totals. Keep the mapping so the next review does not quietly revert to individual billing accounts.
Put revenue, contribution and receivables side by side
Use a consistent period for revenue and contribution. Use a clearly identified date for receivables. These measures answer different questions:
- Revenue share: how much of our sales depends on this relationship?
- Contribution share: how much of the amount available to cover fixed costs and profit depends on it?
- Receivables share: how much of our outstanding customer balance is tied to it today?
Define contribution before calculating it. In the example below, contribution means revenue less the variable costs directly associated with those sales. It excludes fixed operating costs, interest and tax. It is neither EBITDA nor net income. Use the same cost definition for every customer and the company total.
Illustrative scenario. A constructed company has $120 million of annual revenue and $30 million of annual contribution. Customer A provides $24 million of revenue and $9 million of contribution. At the review date, that customer owes $6 million of the company's $15 million in gross trade receivables. These are constructed figures, not KRG client results or industry benchmarks.
Customer A represents 20 percent of revenue, 30 percent of contribution and 40 percent of gross trade receivables. Each percentage uses a different denominator. They are not pieces of one pie, and they should not be added together.
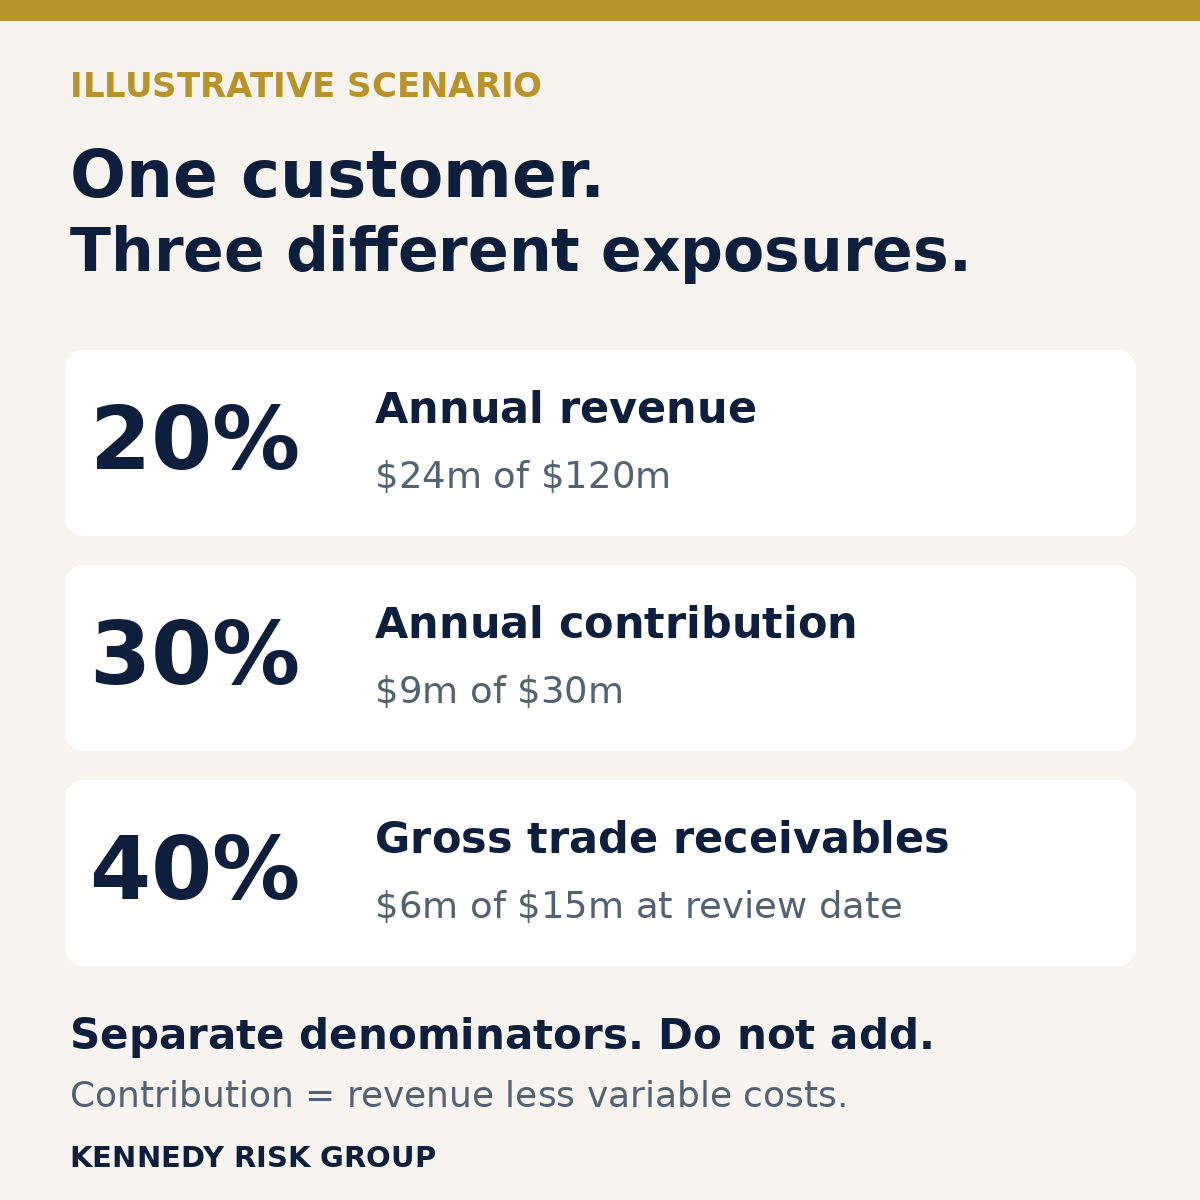
The revenue ranking understates how much this account matters to the company's economics. That does not prove the customer is likely to leave or fail to pay. It tells management where a relationship review deserves attention. The receivables balance also needs context: a seasonal shipment, normal payment terms and an unresolved dispute have different implications.
The calculation behind each percentage
| Measure | Customer A / company | Basis |
|---|---|---|
| Revenue share: 20% | $24m / $120m | Same annual period; net sales on a consistent basis. |
| Contribution share: 30% | $9m / $30m | Same annual period; revenue less directly associated variable costs. |
| Gross trade receivables share: 40% | $6m / $15m | Same review date; before credit-loss allowances. |
All amounts in the table are illustrative US dollars. The formula is customer amount divided by company amount, multiplied by 100. If total contribution is zero or negative, a contribution percentage can be undefined or misleading. Show the dollar amounts and explain the loss-making activities instead of forcing a reassuring ratio.
Test a change in the relationship before modeling a total loss
Losing the customer entirely is one scenario. It may not be the most useful first one. A pricing concession, reduced order volume or slower payment can alter the plan while the customer remains on the account list.
In the illustrative scenario, Customer A has a 37.5 percent contribution margin: $9 million divided by $24 million. If annual sales to that customer fall by 25 percent, revenue falls by $6 million. Assuming the same product mix and contribution margin, contribution falls by $2.25 million. Fixed operating costs remain unchanged in this first pass. This is an annual contribution sensitivity, not a forecast of cash loss.
Now consider a separate event: $2 million of existing invoices is collected after, rather than before, the chosen cash forecast date. Holding other cash movements unchanged, cash at that date is $2 million below the base case. The timing change is not automatically a $2 million expense or a permanent loss.
The SEC's financial-statement guide distinguishes income over a period, balance-sheet amounts at a point in time and actual cash movements. Preserve that distinction in the risk paper. Do not add an annual contribution sensitivity to a delayed-receipt balance and label the result total financial loss.
If the events occur together, build a combined cash forecast. Map reduced receipts, avoided variable-cost payments, inventory commitments and collection timing to their actual dates. Check that the same invoices or cost savings have not appeared twice. Use the existing reverse stress testing guide when you need to work backward from a cash boundary.
Match the response to the actual dependency
"Diversify the customer base" can be a sensible long-term objective. It does little for an invoice due next week. Separate the response that protects cash now from the work that changes the customer portfolio over time.
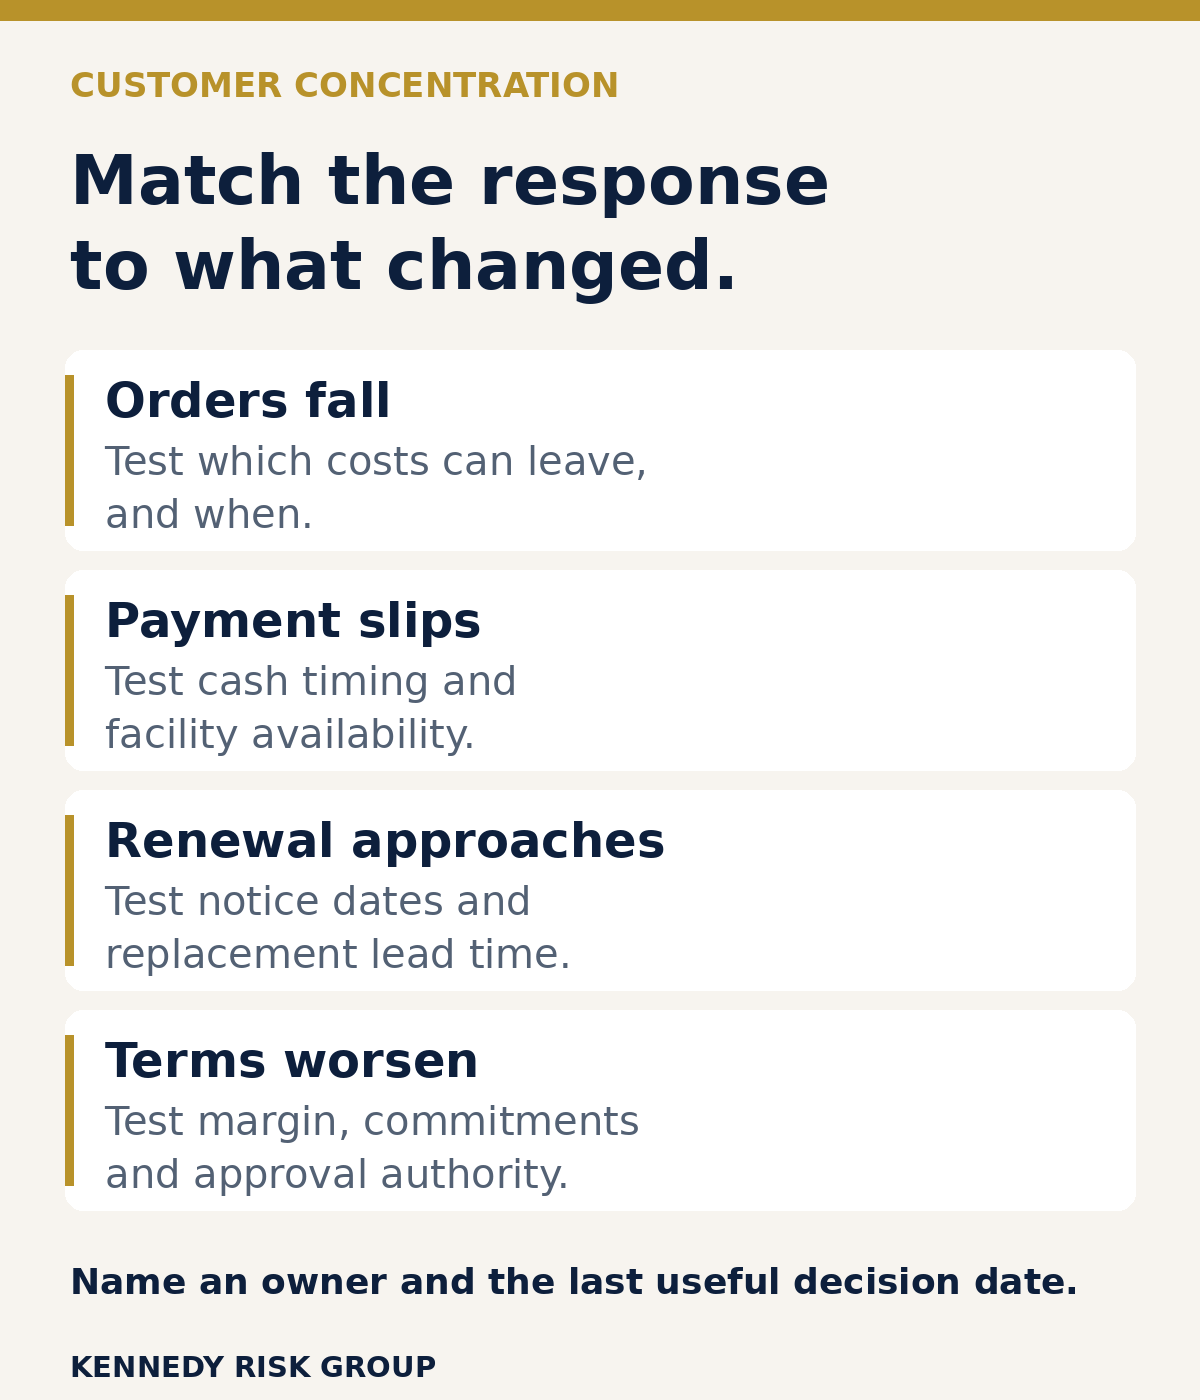
Use these decision prompts:
- Orders fall: test which costs can leave, and when.
- Payment slips: test cash timing and facility availability.
- Renewal approaches: test notice dates and replacement lead time.
- Terms worsen: test margin, commitments and approval authority.
For each response, identify an owner and the last useful decision date. A useful decision date precedes the point when options disappear. It is not automatically the next quarterly risk meeting.
For a volume decline, distinguish variable costs that fall automatically from fixed capacity that needs a separate decision. For late payments, check which invoices are disputed and what collections can reasonably move. If funding is part of the response, treasury should confirm availability under the actual facility terms. An undrawn amount on a slide is not enough evidence.
For a renewal, establish the notice deadline, termination rights and practical replacement lead time with the people responsible for the contract. A multi-year relationship is useful context, but it does not prove the next renewal is secure. Avoid interpreting contract rights without the relevant legal review.
Public-company disclosures show that concentration can involve an intermediary rather than the final customer. Alarm.com's 2025 Form 10-K, in its risk factors, discusses dependence on service provider partners and the effects of reduced purchases or an inability or unwillingness to pay. That is one company's disclosure, not evidence of how common the problem is among mid-market businesses.
Give management a decision, not another ranked list
For the first review, bring finance, sales and operations together around the few relationships whose deterioration could materially change the plan. Include the relevant contract or credit specialist where needed. The enterprise risk workshop playbook provides a reusable facilitation structure; there is no need to create a second workshop process for concentration.
Before the meeting, finance reconciles the data and states the period, date and cost definition. Sales explains the account outlook and buying authority. Operations identifies dedicated inventory, capacity and commitments that would remain if demand changed.
During the meeting, challenge the recovery assumptions. "We can replace the revenue" needs a lead time, a capacity check and credible evidence. "We can reduce costs" needs a specific cost and an effective date. Retain uncertainty where evidence is missing.
The output should state the exposure, the credible change in the relationship, the response management authorizes, the owner and the next decision date. If management accepts the dependency, record why and what would cause it to reconsider. Use the existing board-ready reporting deck when the decision needs board or committee attention.
A good customer can still be the right bet
Reducing concentration at any cost can damage the business. A large customer may support efficient production, predictable demand or attractive contribution. Replacing it with many smaller accounts can introduce acquisition expense, service complexity and collection work.
The relevant comparison is the economics and resilience of the available choices. Growing profitable sales elsewhere can reduce revenue concentration without shrinking the large account. It may take time, and the transition still needs cash and capacity. A ratio that improves because the best customer has already left is not evidence of successful risk management.
Set the limit through the company's risk appetite process. Explain what management is prepared to accept, which evidence it will monitor and when a decision must return for approval. Do not borrow a universal percentage and assume the underlying exposure is controlled.
If a customer decision could change your plan but the reporting still stops at revenue share, start by checking whether your risk reports make that decision visible. The Board-Ready Risk Reporting Scorecard is a practical place to begin.
Take the Board-Ready Risk Reporting Scorecard
Frequently Asked Questions
How do you calculate customer concentration?
Divide the customer or related customer group amount by the company total on the same basis, then multiply by 100. Use a consistent period for revenue and contribution, and a stated date for receivables. Keep those percentages separate.
Is a customer below 10 percent of revenue automatically low risk?
No. A revenue percentage does not establish the contribution, unpaid balance, contract dependency or replacement time. Disclosure thresholds should not be treated as universal management limits.
Should a company reduce its largest customer relationship?
Not automatically. Compare the economics and resilience of the available choices. Growing other profitable relationships, changing commitments or improving terms may address the exposure without shrinking a valuable account.